Hyderabad and Mumbai hold positions in affordability rankings, Knight & Frank India
Despite static affordability at 30%, Hyd’s housing prices surged by 11% in 2023, maintaining its position as the country’s second most expensive residential mkt
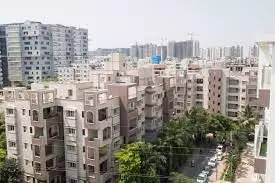
image for illustrative purpose

Hyderabad is the second most expensive residential market in the country. The affordability index of the city remained unchanged at 30 per cent for both the years 2023 and 2022 as home prices increased by a prolific 11 per cent in 2023.
Ahmedabad remains the most affordable housing market in the country with an affordability ratio of 21 per cent which implies that on average a household in Ahmedabad needs to spend 21 per cent of its household income to pay EMI for housing loans. Ahmedabad was followed by Kolkata and Pune at 24 per cent each in 2023.
Kolkata comes second on Knight Frank’s affordability index with a ratio of 24 per cent in 2023. The ratio level of the city has improved by 1 per cent from 2022 and by 8 per cent from the pre-pandemic year of 2019.
Mumbai is the only city beyond the affordability threshold of 50 per cent, a level exceeding which banks rarely underwrite a mortgage. The most expensive residential market of the country, Mumbai, has however seen an improvement of 2 per cent in its affordability index measured at 51 per cent in 2023 from 53 per cent in 2022. Looking at the trend from the pre-pandemic period, the city has witnessed a significant improvement of 16 per cent in its affordability levels from 67 per cent in 2019.
National Capital Region (NCR) has seen its affordability index improve to 27 per cent in 2023 from 29 per cent in 2022.
Bengaluru is the fourth most expensive market with an affordability index of 26 per cent in 2023. The ratio of the city has improved marginally by 1 per cent since 2022 and 6 per cent from the pre-pandemic year of 2019.
Affordability Index of Chennai has improved by 2 per cent from 27 per cent in 2022 to 25 per cent in 2023.
Shishir Baijal, Chairman & Managing Director, Knight Frank India, said, “Anticipating stable GDP growth and moderation in inflation in FY 2024-25, affordability is expected to strengthen. Further, if the RBI decides to lower the repo rate later in 2024 as is widely expected leading to a reduction in home loan interest rates, the affordability of homes in 2024 could see a noteworthy enhancement, providing a comprehensive boost to the sector.”
METHODOLOGY
The Knight Frank Affordability Index indicates the proportion of income that a household requires to fund the monthly instalment (EMI) of a housing unit in a particular city. Thus, the Knight Frank Affordability Index level of 40 per cent for a city implies that on erage, households in that city need to spend 40 per cent of their income to fund the EMI of a housing loan for a unit. An EMI/ Income ratio of over 50 per cent is considered unaffordable as it is the limit beyond which banks rarely underwrite a mortgage.
ASSUMPTIONS
- EMI, housing unit size, and price/sq ft represent city-level averages.
- Loan Tenure – 20 years
- Loan to Value – 80 per cent
- Home Loan Interest Rate – Median MCLR of all scheduled commercial banks with 40 bps spread
- Area of Housing Unit: House sizes are fixed for each city across the years but vary within different cities taking into account the average size preference for each city.
- Housing Price: Median housing price for that city.

